

30
Years of Experience

%100
Renewable Electricity Generation

85
S&P Global ESG Score

537,769 MW
Total Installed Power

4500+
Electric Vehicle Charging Stations

%51
Emission Reduction

We Make a
Difference
We differentiate ourselves among industry players by complementing our engineering, procurement, construction, operation, maintenance, and repair services with our extensive experience and corporate values.

Deadsea Solar Power Plant (PV)
Palestine
Capacity
1,5 MW
2020

Kızıldere I Hybrid Solar Power Plant (PV)
Denizli, TÜRKİYE
Capacity
0,99 MW
2008

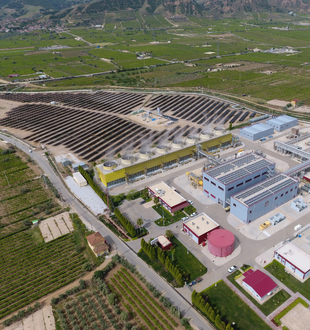
Manisa Alaşehir Hybrid Solar Power Plant (PV)
Manisa, TÜRKİYE
Capacity
3,588 MW
2011

Denizli Kızıldere I,II,III Power Plants
Denizli, TÜRKİYE
Capacity
260 MW Elektrik
2013

Manisa Alaşehir Power Plants
Manisa, TÜRKİYE
Capacity
45 MW
1998

Rize İkizdere Power Plants
Rize, TÜRKİYE
Capacity
24,94 MW Elektrik
2008

Erzincan Tercan Power Plants
Erzincan, TÜRKİYE
Capacity
15 MW Elektrik
2008

Tunceli Mercan Power Plants
Tunceli, TÜRKİYE
Capacity
20,4 MW Elektrik
2008

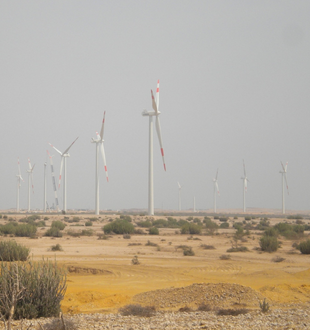
Pakistan Jhimpir Power Plants
Pakistan
Capacity
56,4 MW
2013

Eskişehir Beyköy Power Plants
Eskişehir, TÜRKİYE
Capacity
16,8 MW Elektrik
2008

Erzurum Kuzgun Power Plants
Erzurum, TÜRKİYE
Capacity
20,9 MW Elektrik
2008

Kars Çıldır Power Plants
Kars, TÜRKİYE
Capacity
15,4 MW Elektrik
2008

Tokat Ataköy Power Plants
Tokat, TÜRKİYE
Capacity
5,5 MW Elektrik
2008
We offer innovative solutions.
It continues its research and investment activities in the field of solar energy, which is one of the areas where our country has high potential in terms of clean, green and sustainable energy.
With Our Sustainable Energy Investments, We Embrace an Energetic Future.
With our domestic and renewable energy investments, we are building a sustainable future and contributing to reducing our country's dependence on foreign energy. While ensuring continuity and security in energy supply, we invest in cutting-edge technological solutions.
Keşfet

Investor Relations
We differentiate ourselves among industry players by complementing our engineering, procurement, construction, operation, maintenance, and repair services with our extensive experience and corporate values.
Explore


